
Google Analytics is, by far, the most popular tools for web analytics. It’s free, easy to install and it provides a lot of information about your website. With April Fool’s Day just around the corner, here are 5 super simple tips that will make working with this platform truly a breezer.
Important: This article is meant to be funny and should be viewed accordingly. If you’re a novice in this topic, I wholeheartedly recommend that you read this article on getting value from Google Analytics. It’s a much, much better use of your time.
And now here are the 5 tips:
1. Install the Google Analytics tracking code
There are multiple ways to do this. While it is recommended that you use Google Tag Manager to place the Google Analytics tracking code, you can also do a manual install – aka ask a developer to copy & paste the code on each page. Or you can use dedicated plugins for different content management systems – it’s up to you.
Just install it quickly and don’t worry about any possible errors.
If the Google Analytics tracking code is installed multiple times on a few pages, you will definitely see some good things: a sudden increase in pageviews and a significantly lower bounce rate. The average session length might be affected a bit, too, but that’s another story.
Similarly, if the code is missing from some pages, you’ll notice an increase in sessions. The more pages are missing the Google Analytics tracking code, the higher the increase in sessions.
The important thing is that you get the tracking code installed. Either way, you’ll get some cool graphs that show lots of pageviews and a very low bounce rate.
Make sure you share the good news and build some nice reports around those metrics. That’s solid performance right there.
2. Move fast, adjust later
As mentioned above, speed is of the essence here. To get website data in as quickly as possible, you need to install the code as fast as possible.
Sure, maybe 3 months from now you will realize that some piece of information would be super useful and you haven’t set up for it. But you’ll have plenty of time to adjust the setup, then wait for another month or so until the numbers come in.
Also, don’t worry if your business spans across multiple domains or subdomains. Or if you need additional filters to highlight that information.
Those visits will all be included in the reporting, even Google Analytics will amass them. Just add a secondary dimension in your reports and you’re good to go. More on reports below.
3. Set up Google Analytics goal tracking
An essential part of working with Google Analytics is goal tracking. Goals show how your website is actually performing.
You can choose between 4 different types of goals. To make things as easy as possible, follow the steps below.
Just go to Admin > Properties > View > Goals and click the + New Goal button. And follow the instructions in the image below and Save.![]() (Click to enlarge)
(Click to enlarge)
From now on, basically every page hit your website gets will count as a goal.
With this little trick, your website performance will be through the roof! Also, make sure you define at least 4-5 goals, so the numbers will look even better when compounded.
4. Include ALL website visits
The higher the volume of data, the more reliable your information is. That’s why your Google analytics reports should include all the hits it gets, right? That includes company members who visit the website, your CEO, your testers and developers – all those are perfectly good visits.
You don’t need to proactively do anything to include those. Setting up a filter that excludes internal traffic or installing a Chrome extension to block local visits will only remove the above-mentioned visits from your reports. So you can skip those steps.
Also, let’s not forget bots. Technically, these just break into the Google Analytics reporting but don’t leave the poor things out. To make sure you count those in your reports as well, don’t turn on the Filter bot traffic on the property level.
5. Build some extensive custom reports
At some point, upper management, your marketing manager or any other stakeholder might ask you for a website analytics report.
This is your chance to shine.
Get creative and add as much information as possible. Dive deep into the data and include all the details you can ever think of. I mean ALL of them.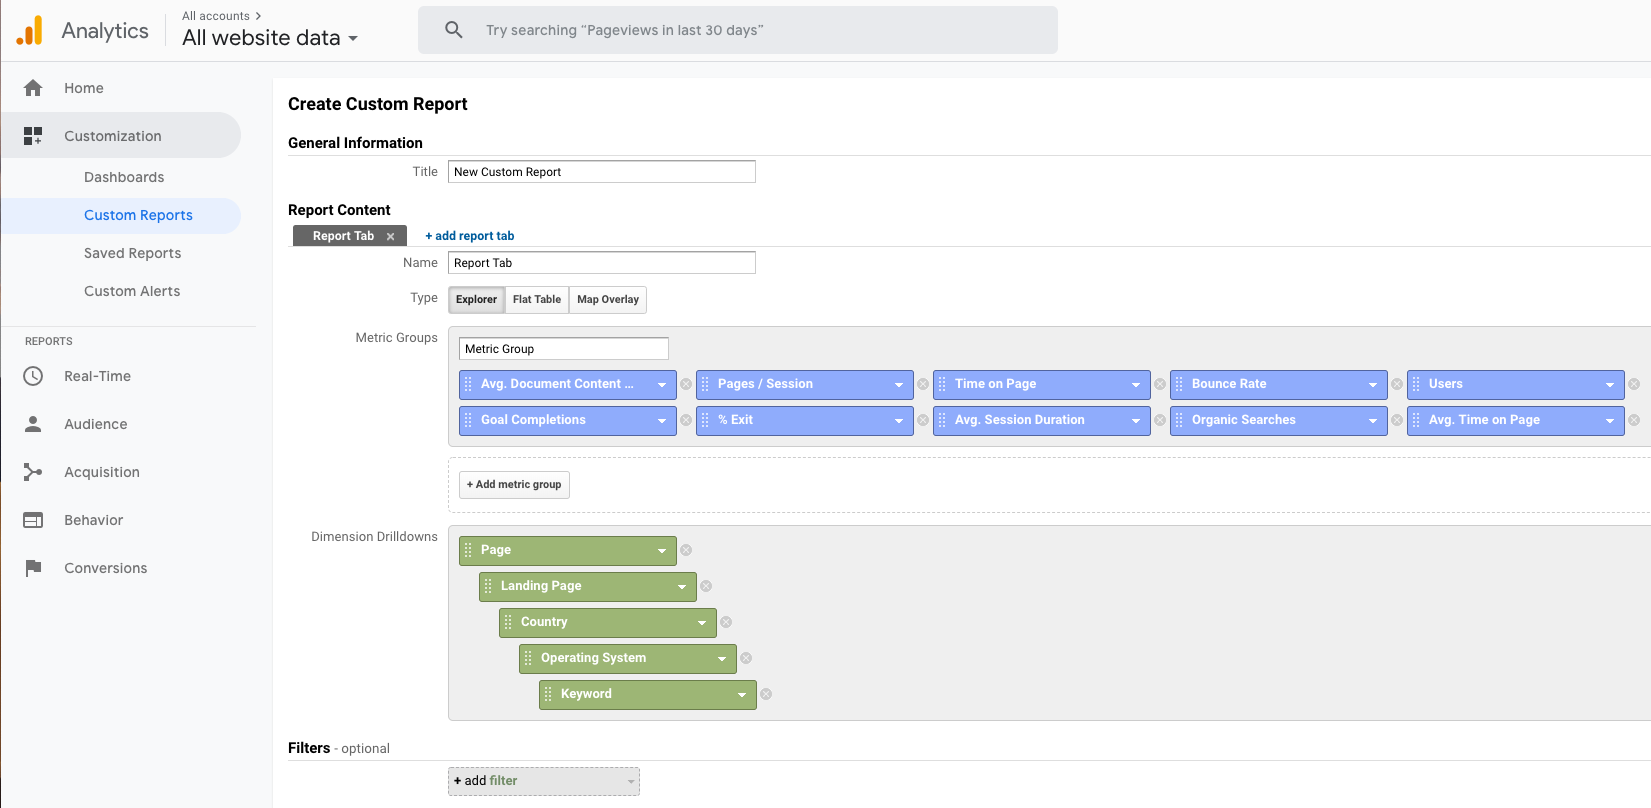 (Click to enlarge)
The more extensive your reports are, the better. It doesn’t matter if you overwhelm your stakeholders with data and details until they get confused and forget what they actually asked for in the first place. When they see your extensive reports, no one will ever dare to question your authority.
Also, strategic decisions need huge amounts of data and that’s your reports should include. If anyone asks, this is serious business and should be treated accordingly. It’s definitely NOT data puking.
Back to reality
OK, April Fool’s Day might be fun, but it lasts only 24 hours. Once the clock strikes midnight, it’s back to the real world.
For the ones working with data and analytics, the struggle is real. We often get huge amounts of (often) bad data. This makes it incredibly hard to extract any valuable information out of it and things start going south.
The first step for getting any value out of data is setting it up properly. This means coming up with a plan on what and how to measure. On top of that, it is essential to make sure that data is clean in order to extract accurate insights from it.
Anything more than that is bells and whistles.
Happy April Fool’s Day – watch out for pranks! 🙂
P.S. – There is another small thing you could do – like forget to tag your email marketing or social media advertising campaigns. It will create additional fun because the marketing team will ask how their campaigns went, but they won’t have any way of finding that out from Google Analytics.